Consider the quarterly production data (in thousands of units)for the XYZ manufacturing company below.The normalized (adjusted)seasonal factors are .9982,.9263,1.139,.9365 for winter,spring,summer and fall respectively. 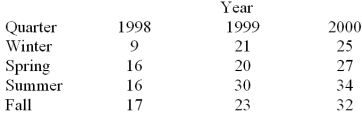 Based on the following deseasonalized observations (dt)given below,a trend line was estimated.
 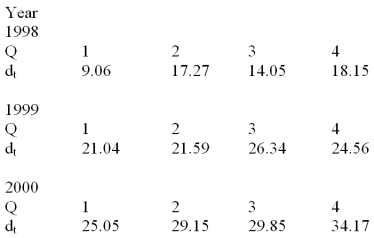 The following MINITAB output gives the straight-line trend equation fitted to the deseasonalized observations.Based on the trend equation given below,calculate the trend value for each period in the time series.
The regression equation is
Deseasonalized = 10.1 + 1.91 Time 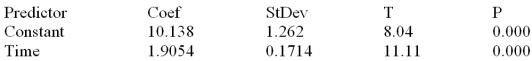
Correct Answer:
Verified
View Answer
Unlock this answer now
Get Access to more Verified Answers free of charge
Q118: Use the following information for the three
Q119: Consider the following set of quarterly sales
Q120: Consider the following set of quarterly sales
Q121: The following data on prices and quantities
Q122: Consider the quarterly production data (in thousands
Q124: Two forecasting models were used to predict
Q125: Consider the quarterly production data (in thousands
Q126: Consider the quarterly production data (in thousands
Q127: Consider the quarterly production data (in thousands
Q128: The following data on prices and quantities
Unlock this Answer For Free Now!
View this answer and more for free by performing one of the following actions

Scan the QR code to install the App and get 2 free unlocks

Unlock quizzes for free by uploading documents