Use the diagram to answer the question.
The curve shows the position of an object with time.The object moves with a constant speed,v. 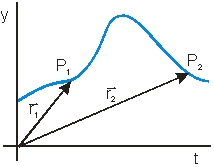
-Which of the vector diagrams below best represent the change in velocity vector from P1 to P2? 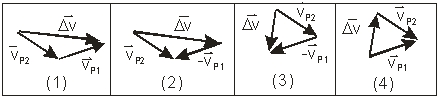
A) (1)
B) (2)
C) (3)
D) (4)
E) None of these is correct.
Correct Answer:
Verified
Q1: A particle has an initial velocity of
Q3: The position vector of an object is
Q4: A car is traveling south at 30
Q5: The position vector of an object is
Q6: You walk 5 km north and then
Q7: A car is traveling east at 50
Q8: The displacement of a particle is _
Q9: The position vector locating the point P(12,-5)relative
Q10: Use the diagram to answer the question.
The
Q11: You walk 12 km south and then
Unlock this Answer For Free Now!
View this answer and more for free by performing one of the following actions

Scan the QR code to install the App and get 2 free unlocks

Unlock quizzes for free by uploading documents