Use the following to answer the question: 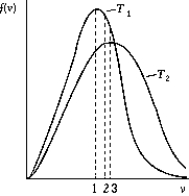
-The figure shows the distribution of the molecular speeds of a gas for two different temperatures.
A) The curve labeled T1 represents the distribution for the higher temperature molecules.
B) The point labeled "1" corresponds to the rms speed of the molecules whose temperature is T1.
C) The point labeled "2" corresponds to the maximum speed of the molecules whose temperature is T1.
D) The point labeled "3" corresponds to the rms speed of the molecules whose temperature is T1.
E) None of these is correct.
Correct Answer:
Verified
Q58: Which of the following is NOT an
Q59: At what Kelvin temperature does the
Q60: At what common Celsius temperature is the
Q61: Use the following to answer the question:
Q62: The rms speed of oxygen molecules is
Q64: Five molecules of a gas have the
Q65: A 1 L container contains O2
Q66: A room measures 3 m
Q67: When the temperature of an ideal gas
Q68: A room measures 3 m
Unlock this Answer For Free Now!
View this answer and more for free by performing one of the following actions

Scan the QR code to install the App and get 2 free unlocks

Unlock quizzes for free by uploading documents