Multiple Choice
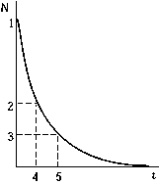 The graph shows the number of radioactive nuclei N remaining as a function of time. The point on the graph that corresponds to the half-life of the decay process is
A) 1
B) 2
C) 3
D) 4
E) 5
Correct Answer:
Verified
Related Questions

