Multiple Choice
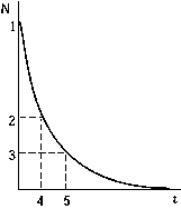 The graph shows the number of nuclei N remaining as a function of time. The point on the graph that corresponds to the number of nuclei remaining after two half-lives have elapsed is
A) 1
B) 2
C) 3
D) 4
E) 5
Correct Answer:
Verified
Related Questions
Q24: The half-life of a radioactive substance is
Q25: The Federal Aviation Administration limits the
Q28: In what type of radioactive decay are
Q45: A radioactive nucleus with Z = 92
Q46: A radioactive source has a half-life of
Q49: The intensity of gamma rays passing
Unlock this Answer For Free Now!
View this answer and more for free by performing one of the following actions

Scan the QR code to install the App and get 2 free unlocks

Unlock quizzes for free by uploading documents