Exhibit 5-2
The diagram below represents the market for butter. 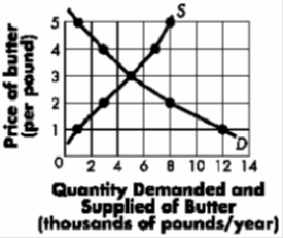
-Refer to Exhibit 5-2. If a price ceiling of $3 is imposed, a shortage of _____units of butter will be created.
A) �zero
B) 3,000
C) 4,000
D) 7,000
Correct Answer:
Verified
Q66: In an effort to reduce the surplus
Q67: Exhibit 5-2
The diagram below represents the market
Q68: Exhibit 5-2
The diagram below represents the market
Q69: Exhibit 5-2
The diagram below represents the market
Q70: Exhibit 5-2
The diagram below represents the market
Q72: A safety report is released that contends
Q73: Exhibit 5-4 Q74: Which of the following would most likely Q75: Exhibit 5-4 Q76: In 1975 a pocket calculator cost more
![]()
![]()
Unlock this Answer For Free Now!
View this answer and more for free by performing one of the following actions

Scan the QR code to install the App and get 2 free unlocks

Unlock quizzes for free by uploading documents