Exhibit 5-2
The diagram below represents the market for butter. 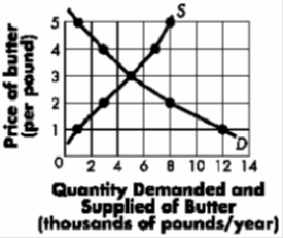
-Refer to Exhibit 5-3. Which of the following price controls would cause a surplus of 20 units of the good?
A) a price floor set at $15
B) a price ceiling set at $15
C) a price floor set at $35
D) a price ceiling set at $35
Correct Answer:
Verified
Q63: Exhibit 5-4 Q64: Exhibit 5-4 Q65: Exhibit 5-2 Q66: In an effort to reduce the surplus Q67: Exhibit 5-2 Q69: Exhibit 5-2 Q70: Exhibit 5-2 Q71: Exhibit 5-2 Q72: A safety report is released that contends Q73: Exhibit 5-4 Unlock this Answer For Free Now! View this answer and more for free by performing one of the following actions Scan the QR code to install the App and get 2 free unlocks Unlock quizzes for free by uploading documents
![]()
![]()
The diagram below represents the market
The diagram below represents the market
The diagram below represents the market
The diagram below represents the market
The diagram below represents the market
![]()

