Exhibit 18.3.The following table shows the annual revenues (in millions of dollars) of a pharmaceutical company over the period 1990-2011. 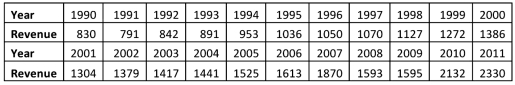
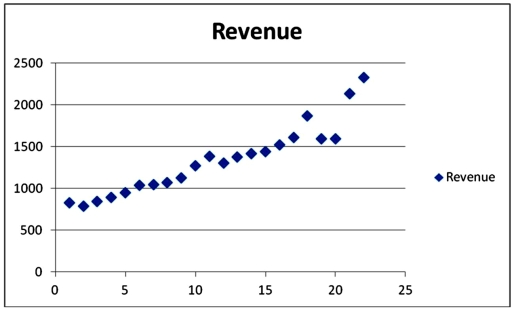 Excel scatterplot shown above indicates that the annual revenues have an increasing trend.Therefore,linear,exponential,quadratic and cubic models were used to fit the trend,and the following relevant information became available after applying linear regression.
 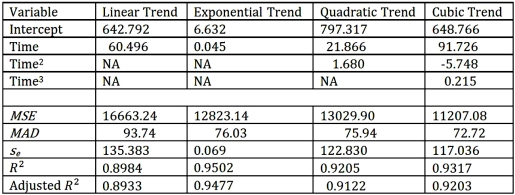 Refer to Exhibit 18.3.When all four trend regression equations are compared,which of them provides the best fit?
A) linear
B) exponential
C) quadratic
D) cubic
Correct Answer:
Verified
Q75: If the model Q77: Which of the following is not true Q78: In the decomposition method,which of the following Q79: In the decomposition method,which of the following Q81: Exhibit 18.7.The following table shows the annual Q82: Exhibit 18.5.Based on quarterly data collected over Q83: Exhibit 18.6.Based on quarterly data collected over![]()
Unlock this Answer For Free Now!
View this answer and more for free by performing one of the following actions

Scan the QR code to install the App and get 2 free unlocks

Unlock quizzes for free by uploading documents