Exhibit 18.7.The following table shows the annual revenues (in millions of dollars)of a pharmaceutical company over the period 1990-2011.  The autoregressive models of order 1 and 2,
  and
and  ,were applied on the time series to make revenue forecasts.The relevant parts of Excel regression outputs are given below.
Model AR(1):  Model AR(2):
 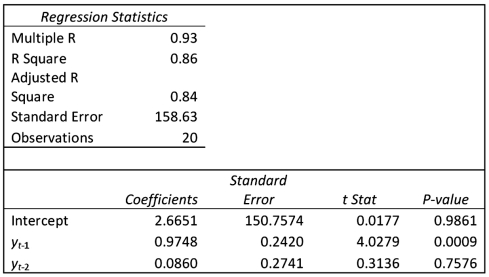 Refer to Exhibit 18.7.When for AR(1),H0: β0 = 0 is tested against HA: β0 ≠ 0,the p-value of this t test shown by Excel output is 0.9590.This could suggest that the model
 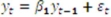 .might be an alternative to the AR(1)model
 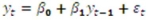 .Excel partial output for this simplified model is:
 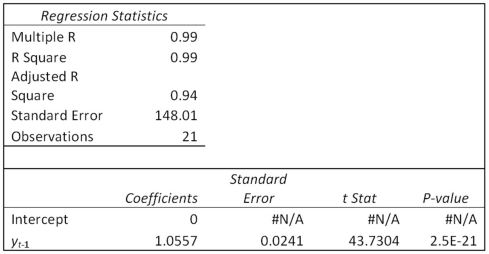 Find the revenue forecast for 2012 through the use of
  .
.
Correct Answer:
Verified
Q77: Which of the following is not true
Q78: In the decomposition method,which of the following
Q79: In the decomposition method,which of the following
Q80: Exhibit 18.3.The following table shows the annual
Q82: Exhibit 18.5.Based on quarterly data collected over
Q83: Exhibit 18.6.Based on quarterly data collected over
Unlock this Answer For Free Now!
View this answer and more for free by performing one of the following actions

Scan the QR code to install the App and get 2 free unlocks

Unlock quizzes for free by uploading documents