Exhibit 18.7.The following table shows the annual revenues (in millions of dollars)of a pharmaceutical company over the period 1990-2011. 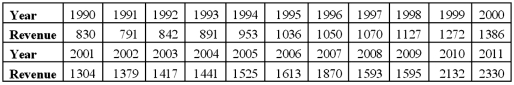 The autoregressive models of order 1 and 2,
 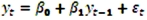 and
and  ,were applied on the time series to make revenue forecasts.The relevant parts of Excel regression outputs are given below.
Model AR(1): 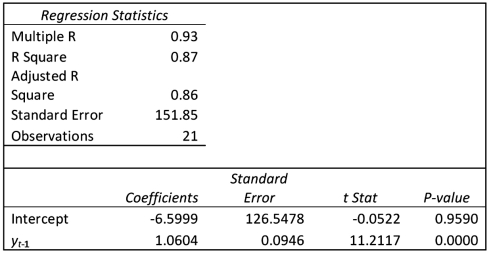 Model AR(2):
 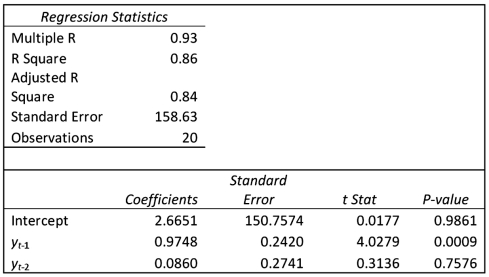 Refer to Exhibit 18.7.Using AR(2)model,find the company revenue forecast for 2012.
Correct Answer:
Verified
View Answer
Unlock this answer now
Get Access to more Verified Answers free of charge
Q85: Exhibit 18.5.Based on quarterly data collected over
Q86: Exhibit 18.8.Quarterly sales of a department store
Q87: If T denotes the number of observations,which
Q88: Exhibit 18.7.The following table shows the annual
Q89: Exhibit 18.8.Quarterly sales of a department store
Q91: Exhibit 18.6.Based on quarterly data collected over
Unlock this Answer For Free Now!
View this answer and more for free by performing one of the following actions

Scan the QR code to install the App and get 2 free unlocks

Unlock quizzes for free by uploading documents