Exhibit 16-1.The following Excel scatterplot with the fitted quadratic regression equation illustrates the observed relationship between productivity and the number of hired workers. 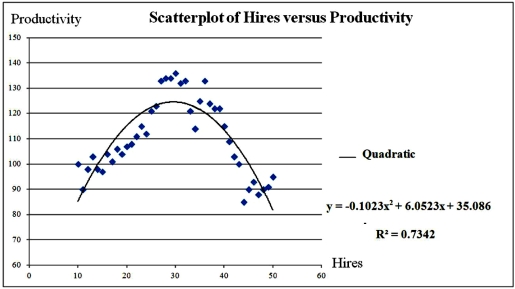 Refer to Exhibit 16.1.Predict the productivity when 32 workers are hired.
A) 124.00
B) 122.46
C) 121.60
D) 113.50
Correct Answer:
Verified
Q33: Exhibit 16-1.The following Excel scatterplot with the
Q34: Exhibit 16.2.Typically,the sales volume declines with an
Q35: For the quadratic equation Q36: Exhibit 16.2.Typically,the sales volume declines with an Q37: Exhibit 16.2.Typically,the sales volume declines with an Q39: Exhibit 16.2.Typically,the sales volume declines with an Q41: For which of the following models,the formula Q43: When the predicted value of the response Q47: The coefficient of determination R2 cannot be Q58: A model in which the response variable![]()
Unlock this Answer For Free Now!
View this answer and more for free by performing one of the following actions

Scan the QR code to install the App and get 2 free unlocks

Unlock quizzes for free by uploading documents