Exhibit 16.2.Typically,the sales volume declines with an increase of a product price.It has been observed,however,that for some luxury goods the sales volume may increase when the price increases.The following Excel output illustrates this rather unusual relationship. 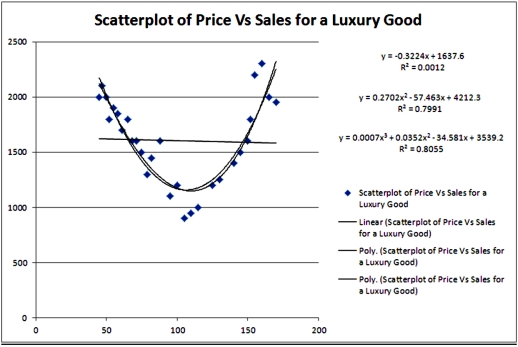 Refer to Exhibit 16.2.Which of the following models is most likely to be chosen in order to describe the relationship between Price and Sales?
A) Linear
B) Quadratic
C) Cubic
D) Exponential
Correct Answer:
Verified
Q31: Exhibit 16-1.The following Excel scatterplot with the
Q32: Given the data on y and x,what
Q33: Exhibit 16-1.The following Excel scatterplot with the
Q34: Exhibit 16.2.Typically,the sales volume declines with an
Q35: For the quadratic equation Q37: Exhibit 16.2.Typically,the sales volume declines with an Q38: Exhibit 16-1.The following Excel scatterplot with the Q39: Exhibit 16.2.Typically,the sales volume declines with an Q41: For which of the following models,the formula Q47: The coefficient of determination R2 cannot be![]()
Unlock this Answer For Free Now!
View this answer and more for free by performing one of the following actions

Scan the QR code to install the App and get 2 free unlocks

Unlock quizzes for free by uploading documents