Exhibit 13.3 The ANOVA test performed for Exhibit 13.2 determined that not all mean commute times across the four cities are equal.However,it did not indicate which means differed.To find out which population means differ requires further analysis of the direction and the statistical significance of the difference between paired population means.Fisher 95% confidence intervals are shown below. 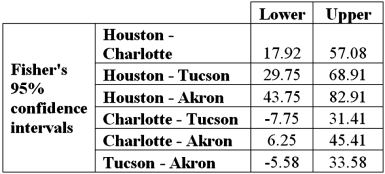 Refer to Exhibit 13.3.Which of the following is the
  value used to calculate the Fisher 95% confidence intervals?
A) 1.725
B) 2.086
C) 2.080
D) 2.090
Correct Answer:
Verified
Q42: Exhibit 13.3 The ANOVA test performed for
Q43: Exhibit 13.6 A researcher wants to understand
Q44: Exhibit 13.6 A researcher wants to understand
Q45: Exhibit 13.5 A police chief wants to
Q46: Exhibit 13.5 A police chief wants to
Q48: Exhibit 13.6 A researcher wants to understand
Q49: Exhibit 13.6 A researcher wants to understand
Q50: Exhibit 13.5 A police chief wants to
Q51: Exhibit 13.3 The ANOVA test performed for
Q52: Exhibit 13.5 A police chief wants to
Unlock this Answer For Free Now!
View this answer and more for free by performing one of the following actions

Scan the QR code to install the App and get 2 free unlocks

Unlock quizzes for free by uploading documents