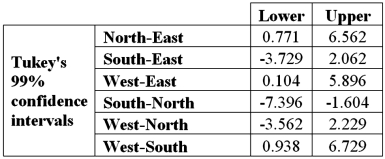
Exhibit 13.5 A police chief wants to determine if crime rates are different for four different areas of the city (East(1) ,West(2) ,North(3) ,and South(4) sides) ,and obtains data on the number of crimes per day in each area.The one-way ANOVA table and Tukey's confidence intervals are shown below. 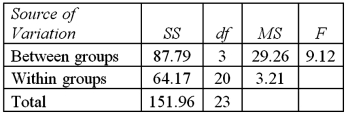
 Refer to Exhibit 13.5.At the 1% significance level,the conclusion for the hypothesis test is:
A) Reject the null hypothesis,not all mean number of crimes are equal
B) Do not reject the null hypothesis,not all mean number of crimes are equal
C) Reject the null hypothesis,cannot conclude that not all mean number of crimes are equal
D) Do not reject the null hypothesis,cannot conclude that not all mean number of crimes are equal
Correct Answer:
Verified
Q40: Exhibit 13.1 The following is an incomplete
Q41: Exhibit 13.4 The ANOVA test performed for
Q42: Exhibit 13.3 The ANOVA test performed for
Q43: Exhibit 13.6 A researcher wants to understand
Q44: Exhibit 13.6 A researcher wants to understand
Q46: Exhibit 13.5 A police chief wants to
Q47: Exhibit 13.3 The ANOVA test performed for
Q48: Exhibit 13.6 A researcher wants to understand
Q49: Exhibit 13.6 A researcher wants to understand
Q50: Exhibit 13.5 A police chief wants to
Unlock this Answer For Free Now!
View this answer and more for free by performing one of the following actions

Scan the QR code to install the App and get 2 free unlocks

Unlock quizzes for free by uploading documents