Exhibit 12.5 In the following table,individuals are cross-classified by their age group and income level. 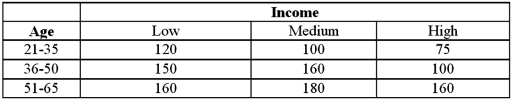 Refer to Exhibit 12.5.For the chi-square test of independence,the value of the test statistic is:
A) 8.779
B) 10.840
C) 13.243
D) 16.159
Correct Answer:
Verified
Q59: Exhibit 12.2 A university has six colleges
Q60: Exhibit 12.4 In the following table,likely voters'
Q61: Exhibit 12.5 In the following table,individuals are
Q62: Exhibit 12.6 The following table shows the
Q63: Exhibit 12.5 In the following table,individuals are
Q65: Exhibit 12.6 The following table shows the
Q66: Exhibit 12.6 The following table shows the
Q67: Exhibit 12.6 The following table shows the
Q68: Exhibit 12.5 In the following table,individuals are
Q69: Exhibit 12.5 In the following table,individuals are
Unlock this Answer For Free Now!
View this answer and more for free by performing one of the following actions

Scan the QR code to install the App and get 2 free unlocks

Unlock quizzes for free by uploading documents