Exhibit 12.5 In the following table,individuals are cross-classified by their age group and income level. 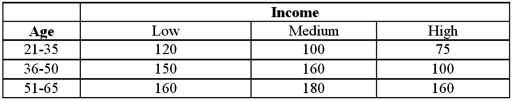 Refer to Exhibit 12.5.The p-value is:
A) Less than 0.01
B) Between 0.01 and 0.05
C) Between 0.05 and 0.10
D) Greater than 0.10
Correct Answer:
Verified
Q63: Exhibit 12.5 In the following table,individuals are
Q64: Exhibit 12.5 In the following table,individuals are
Q65: Exhibit 12.6 The following table shows the
Q66: Exhibit 12.6 The following table shows the
Q67: Exhibit 12.6 The following table shows the
Q69: Exhibit 12.5 In the following table,individuals are
Q70: Exhibit 12.6 The following table shows the
Q71: Exhibit 12.5 In the following table,individuals are
Q72: Exhibit 12.6 The following table shows the
Q73: Exhibit 12.5 In the following table,individuals are
Unlock this Answer For Free Now!
View this answer and more for free by performing one of the following actions

Scan the QR code to install the App and get 2 free unlocks

Unlock quizzes for free by uploading documents