Exhibit 12.5 In the following table,individuals are cross-classified by their age group and income level. 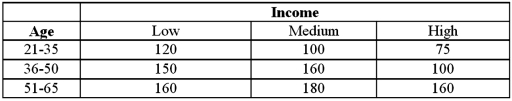 Refer to Exhibit 12.5.At the 5% significance level,the critical value is:
A) 13.277
B) 11.143
C) 9.488
D) 7.779
Correct Answer:
Verified
Q68: Exhibit 12.5 In the following table,individuals are
Q69: Exhibit 12.5 In the following table,individuals are
Q70: Exhibit 12.6 The following table shows the
Q71: Exhibit 12.5 In the following table,individuals are
Q72: Exhibit 12.6 The following table shows the
Q74: Exhibit 12.6 The following table shows the
Q75: Exhibit 12.6 The following table shows the
Q76: Exhibit 12.5 In the following table,individuals are
Q77: Exhibit 12.6 The following table shows the
Q78: Exhibit 12.7 The heights (in cm)for a
Unlock this Answer For Free Now!
View this answer and more for free by performing one of the following actions

Scan the QR code to install the App and get 2 free unlocks

Unlock quizzes for free by uploading documents