Exhibit 12.5 In the following table,individuals are cross-classified by their age group and income level. 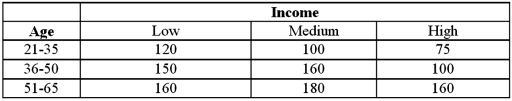 Refer to Exhibit 12.5.Assuming age group and income are independent,the expected 'low income and 21-35 age group' cell frequency is:
A) 105.27
B) 107.72
C) 146.31
D) 178.42
Correct Answer:
Verified
Q71: Exhibit 12.5 In the following table,individuals are
Q72: Exhibit 12.6 The following table shows the
Q73: Exhibit 12.5 In the following table,individuals are
Q74: Exhibit 12.6 The following table shows the
Q75: Exhibit 12.6 The following table shows the
Q77: Exhibit 12.6 The following table shows the
Q78: Exhibit 12.7 The heights (in cm)for a
Q79: Exhibit 12.6 The following table shows the
Q80: Exhibit 12.7 The heights (in cm)for a
Q81: A researcher wants to determine if the
Unlock this Answer For Free Now!
View this answer and more for free by performing one of the following actions

Scan the QR code to install the App and get 2 free unlocks

Unlock quizzes for free by uploading documents