Exhibit 12.7 The heights (in cm) for a random sample of 60 males were measured.The sample mean is 166.55,the standard deviation is 12.57,the sample kurtosis is 0.12,and the sample skewness is -0.23.The following table shows the heights subdivided into non-overlapping intervals. 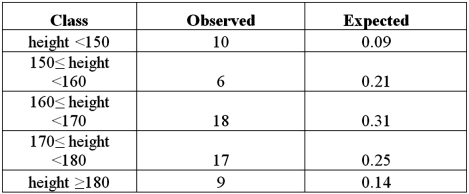 Refer to Exhibit 12.7.For the chi-square test for normality,the null and alternative hypothesis are:
A) 
B) 
C) 
D) 
Correct Answer:
Verified
Q75: Exhibit 12.6 The following table shows the
Q76: Exhibit 12.5 In the following table,individuals are
Q77: Exhibit 12.6 The following table shows the
Q78: Exhibit 12.7 The heights (in cm)for a
Q79: Exhibit 12.6 The following table shows the
Q81: A researcher wants to determine if the
Q82: Exhibit 12.8 The heights (in cm)for a
Q83: Exhibit 12.7 The heights (in cm)for a
Q84: The following table shows the observed frequencies
Q85: Exhibit 12.7 The heights (in cm)for a
Unlock this Answer For Free Now!
View this answer and more for free by performing one of the following actions

Scan the QR code to install the App and get 2 free unlocks

Unlock quizzes for free by uploading documents