The following table shows the observed frequencies of the quarterly returns for a sample of 60 hedge funds.The table also contains the hypothesized proportions of each class assuming the quarterly returns have a normal distribution.The sample mean and standard deviation are 3.6% and 7.4% respectively. 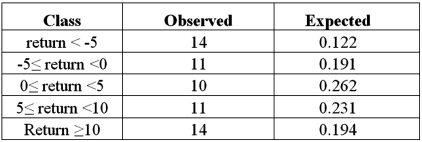
A)Set up the competing hypotheses for the goodness-of-fit test of normality for the quarterly returns.
B)Calculate the value of the test statistic and determine the degrees of freedom.
C)Compute the p-value.Does the evidence suggest that the quarterly returns do not have a normal distribution at the 10% significance level?
Correct Answer:
Verified
View Answer
Unlock this answer now
Get Access to more Verified Answers free of charge
Q79: Exhibit 12.6 The following table shows the
Q80: Exhibit 12.7 The heights (in cm)for a
Q81: A researcher wants to determine if the
Q82: Exhibit 12.8 The heights (in cm)for a
Q83: Exhibit 12.7 The heights (in cm)for a
Q85: Exhibit 12.7 The heights (in cm)for a
Q87: A researcher wants to verify his belief
Q88: Exhibit 12.8 The heights (in cm)for a
Q89: Exhibit 12.8 The heights (in cm)for a
Q120: A travel agent wants to determine if
Unlock this Answer For Free Now!
View this answer and more for free by performing one of the following actions

Scan the QR code to install the App and get 2 free unlocks

Unlock quizzes for free by uploading documents