The following table shows the number of payroll jobs the government added during the years its added jobs (since 1973) .The jobs are in thousands. 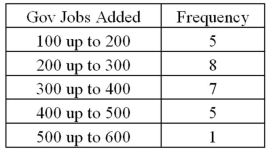 Approximately what percent of the time did the government add 200,000 or more jobs?
A) 19%
B) 50%
C) 77%
D) 81%
Correct Answer:
Verified
Q71: A stem-and-leaf diagram is constructed by separating
Q75: Exhibit 2-13.The organization of the Girl Sprouts
Q76: What type of relationship is indicated in
Q78: What type of relationship is indicated in
Q79: Exhibit 2-14.In the accompanying stem-and-leaf diagram,the values
Q81: The following table lists some of the
Q82: Johnson and Johnson (JNJ)is a consumer staples
Q83: The following table shows analyst sentiment ratings
Q84: Each month the Bureau of Labor Statistics
Q85: The following table shows average wind speeds
Unlock this Answer For Free Now!
View this answer and more for free by performing one of the following actions

Scan the QR code to install the App and get 2 free unlocks

Unlock quizzes for free by uploading documents