Each month the Bureau of Labor Statistics reports the number of people (in thousands)employed in the United States by age.The accompanying frequency distribution shows the results for August 2011 (Source: http://data.bls.gov/pdq/SurveyOutputServlet). 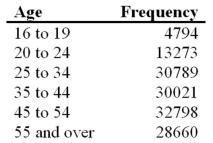 a.Construct a relative frequency distribution.What proportion of workers is between 20 and 24 years old?
B)Construct a cumulative relative frequency distribution.What proportion of workers is younger than 35 years old?
C)Construct a relative frequency histogram.
Correct Answer:
Verified
View Answer
Unlock this answer now
Get Access to more Verified Answers free of charge
Q79: Exhibit 2-14.In the accompanying stem-and-leaf diagram,the values
Q80: The following table shows the number of
Q81: The following table lists some of the
Q82: Johnson and Johnson (JNJ)is a consumer staples
Q83: The following table shows analyst sentiment ratings
Q85: The following table shows average wind speeds
Q86: The dividend yields of the stocks in
Q87: The following data represent the ages of
Q88: Construct a stem-and-leaf diagram for the following
Q89: Use the following data to construct a
Unlock this Answer For Free Now!
View this answer and more for free by performing one of the following actions

Scan the QR code to install the App and get 2 free unlocks

Unlock quizzes for free by uploading documents