The following table gives a numerical example of an aggregate demand/inflation curve. 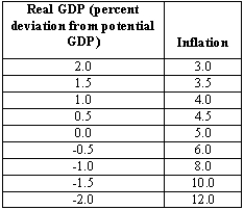 (A)Sketch the curve in a graph.
(B)What is the average rate of inflation in the long run?
(C)Suppose the central bank decreases the target rate of inflation to 2 percent.Sketch a new AD curve corresponding to the new lower money supply growth rate.How does the new curve compare with the old curve?
(D)What will happen to the average rate of inflation in the long run (assuming potential GDP growth does not change)?
Correct Answer:
Verified
View Answer
Unlock this answer now
Get Access to more Verified Answers free of charge
Q185: During a recession, the rate of inflation
Q186: What is the difference between the AD
Q194: Which of the following statements is true?
A)The
Q200: Use the AD curve and IA line
Q201: The following table gives a numerical example
Q202: Suppose the Fed is considering three different
Q202: Since changes in both monetary policy and
Q204: Suppose that,as a result of accelerated growth
Q206: Consider the following monetary policy rules for
Q207: State which of the following changes causes
Unlock this Answer For Free Now!
View this answer and more for free by performing one of the following actions

Scan the QR code to install the App and get 2 free unlocks

Unlock quizzes for free by uploading documents