The following table gives a numerical example of the inflation adjustment line in the year 2007. 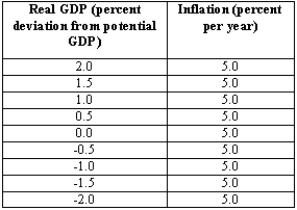 (A)Sketch the line in a graph.
(B)If real GDP is below potential GDP in the year 2007,will the inflation adjustment line shift up or down in the year 2008?
(C)In the same graph as part (A),sketch an aggregate demand curve.Find the equilibrium level of inflation and real GDP in the year 2008.
(D)What will happen to the inflation adjustment line if oil prices suddenly increase?
Correct Answer:
Verified
View Answer
Unlock this answer now
Get Access to more Verified Answers free of charge
Q185: During a recession, the rate of inflation
Q186: What is the difference between the AD
Q194: Which of the following statements is true?
A)The
Q198: The aggregate demand curve and the inflation
Q200: Use the AD curve and IA line
Q202: Suppose the Fed is considering three different
Q202: Since changes in both monetary policy and
Q203: The following table gives a numerical example
Q204: Suppose that,as a result of accelerated growth
Q206: Consider the following monetary policy rules for
Unlock this Answer For Free Now!
View this answer and more for free by performing one of the following actions

Scan the QR code to install the App and get 2 free unlocks

Unlock quizzes for free by uploading documents