An introductory statistics class decides to investigate whether there is a relationship between the performance on midterms 1 and 2. The instructor creates a scatterplot of midterm 2 scores (y) versus midterm 1 scores (x) . 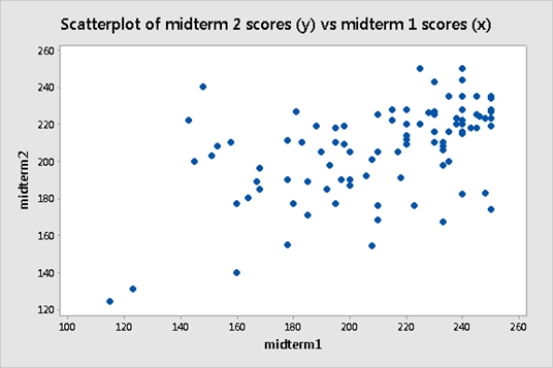 Based on the plot, which of the following is likely true?
A) The correlation between midterm 1 and midterm 2 scores is positive.
B) Students who did well on midterm 1 did not do so well on midterm 2, and vice versa.
C) There is no relationship between midterm 1 and midterm 2 performance.
D) None of the answer options is correct.
Correct Answer:
Verified
Q2: What can be said of the correlation
Q3: A researcher states that bone density in
Q4: Archaeologists often find only parts of ancient
Q5: Are higher than average sea surface temperatures
Q6: A group of students participated in an
Q7: The volume of oxygen consumed (in liters
Q8: Below is a scatterplot of the number
Q9: Colleges often rely heavily on raising money
Q10: When water flows across farmland, some soil
Q11: The graph below shows a scatterplot of
Unlock this Answer For Free Now!
View this answer and more for free by performing one of the following actions

Scan the QR code to install the App and get 2 free unlocks

Unlock quizzes for free by uploading documents