A poll was conducted of more than 50,000 buyers of new cars, 90 days after the cars were purchased. The data on problems per 100 vehicles for cars made by Toyota and General Motors (GM) are given in the time plot below for the years 1998-2004. The solid line is for GM and the dashed line is for Toyota. 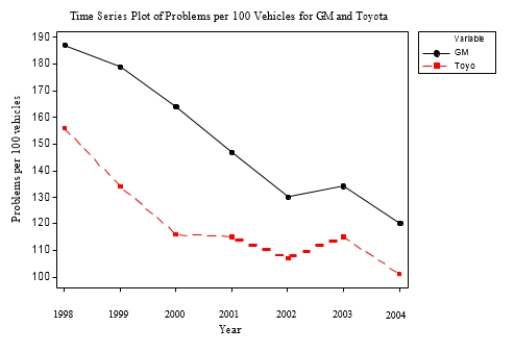 Which of the following is a true statement?
A) The quality of cars is getting poorer for both companies.
B) The number of problems was higher for GM than for Toyota in each year.
C) The difference in the number of problems per 100 vehicles between GM and Toyota is less than 30 for each year.
D) All of the answer options are correct.
Correct Answer:
Verified
Q8: The following histogram represents the distribution
Q9: The stemplot below displays midterm exam
Q10: A large university is divided into six
Q11: A sample of 40 employees from the
Q12: A poll was conducted of more than
Q14: A description of different houses for sale
Q15: A sample of 40 employees from the
Q16: The difference between a frequency histogram and
Q17: The following is a histogram showing the
Q18: What is the difference between a histogram
Unlock this Answer For Free Now!
View this answer and more for free by performing one of the following actions

Scan the QR code to install the App and get 2 free unlocks

Unlock quizzes for free by uploading documents