A sample of 40 employees from the local Honda plant was obtained, and the length of time (in months) that each employee has worked at the plant was recorded. A stemplot of these data follows. In the stemplot, 5|2 represents 52 months. 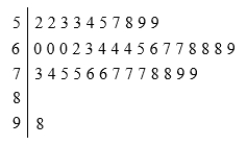 What would be a better way to represent this data set?
A) Display the data in a time plot.
B) Split the stems.
C) Use a pie chart.
D) Use a histogram with class width equal to 10.
Correct Answer:
Verified
Q10: A large university is divided into six
Q11: A sample of 40 employees from the
Q12: A poll was conducted of more than
Q13: A poll was conducted of more than
Q14: A description of different houses for sale
Q16: The difference between a frequency histogram and
Q17: The following is a histogram showing the
Q18: What is the difference between a histogram
Q19: Consumers' Union measured the gas mileage per
Q20: A large university is divided into six
Unlock this Answer For Free Now!
View this answer and more for free by performing one of the following actions

Scan the QR code to install the App and get 2 free unlocks

Unlock quizzes for free by uploading documents