Consumers' Union measured the gas mileage per gallon of thirty-eight 1998-99 model automobiles on a special test track. The following pie chart provides information about the country of manufacture of the cars that Consumers' Union used. 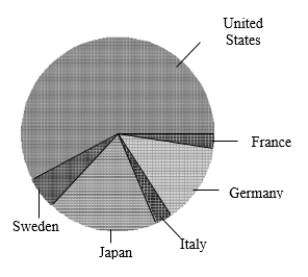 Based on this pie chart, we may conclude that:
A) Japanese cars get significantly lower gas mileage than cars of other countries. We know this because their slice of the pie is at the bottom of the chart.
B) More than half of the cars in the study were from the United States.
C) Swedish cars get gas mileages that are between those of Japanese cars and U.S. cars.
D) Mercedes Benz, Audi, Porsche, and BMW represent approximately one-quarter of the cars tested.
Correct Answer:
Verified
Q14: A description of different houses for sale
Q15: A sample of 40 employees from the
Q16: The difference between a frequency histogram and
Q17: The following is a histogram showing the
Q18: What is the difference between a histogram
Q20: A large university is divided into six
Q21: Which statement is the most important to
Q22: Enteroliths are calcifications that form in the
Q23: A survey of radio stations was
Q24: A survey of radio stations was conducted
Unlock this Answer For Free Now!
View this answer and more for free by performing one of the following actions

Scan the QR code to install the App and get 2 free unlocks

Unlock quizzes for free by uploading documents