A large university is divided into six colleges, with most students graduating from one of four of these colleges. The following bar chart gives the distribution of the percent graduating from each of these four most popular colleges in 2003. 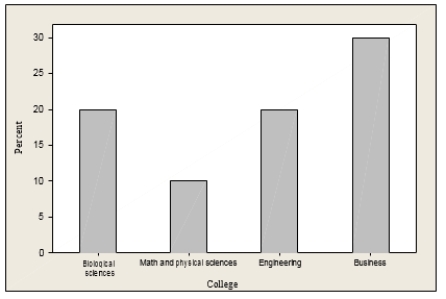 Which of the following is a correct statement?
A) A time plot of the 2003 distribution would be more informative.
B) The bar graph is skewed to the right.
C) The bar graph is skewed to the left.
D) None of the answer options is correct.
Correct Answer:
Verified
Q15: A sample of 40 employees from the
Q16: The difference between a frequency histogram and
Q17: The following is a histogram showing the
Q18: What is the difference between a histogram
Q19: Consumers' Union measured the gas mileage per
Q21: Which statement is the most important to
Q22: Enteroliths are calcifications that form in the
Q23: A survey of radio stations was
Q24: A survey of radio stations was conducted
Q25: A survey of radio stations was conducted
Unlock this Answer For Free Now!
View this answer and more for free by performing one of the following actions

Scan the QR code to install the App and get 2 free unlocks

Unlock quizzes for free by uploading documents