The following is a histogram showing the distribution per year of the cumulative property damage caused by tornadoes, over the period 1950 to 1999, in each of the 50 states and Puerto Rico. The data are in millions of dollars, and the class intervals are 0 to < 10, 10 to < 20, and so forth. 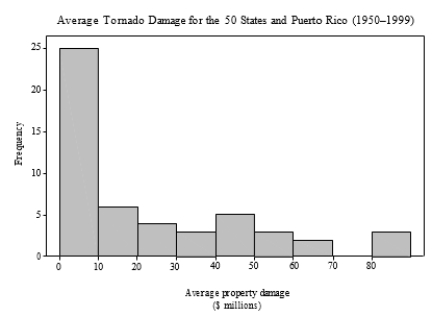 Which of the following statements is true?
A) Approximately 25% of the tornadoes caused less than $10 million in damage.
B) Approximately 25% of the annual reports of property damage were less than $10 million.
C) Approximately 50% of the annual reports of property damage were less than $10 million.
D) None of the answer options is correct.
Correct Answer:
Verified
Q12: A poll was conducted of more than
Q13: A poll was conducted of more than
Q14: A description of different houses for sale
Q15: A sample of 40 employees from the
Q16: The difference between a frequency histogram and
Q18: What is the difference between a histogram
Q19: Consumers' Union measured the gas mileage per
Q20: A large university is divided into six
Q21: Which statement is the most important to
Q22: Enteroliths are calcifications that form in the
Unlock this Answer For Free Now!
View this answer and more for free by performing one of the following actions

Scan the QR code to install the App and get 2 free unlocks

Unlock quizzes for free by uploading documents