Figure 12-2. On the graph, MS represents the money supply and MD represents money demand. The usual quantities are measured along the axes.
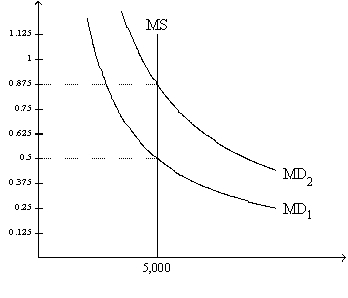
-Refer to Figure 12-2. What quantity is measured along the horizontal axis?
A) the price level
B) the real interest rate
C) the value of money
D) the quantity of money
Correct Answer:
Verified
Q81: Economic variables whose values are measured in
Q82: Economic variables whose values are measured in
Q88: Figure 12-3. On the graph, MS represents
Q89: Figure 12-2. On the graph, MS represents
Q90: Figure 12-1 Q91: Figure 12-1 Q93: Figure 12-2. On the graph, MS represents Q94: Figure 12-2. On the graph, MS represents Q96: Figure 12-1 Q97: Figure 12-3. On the graph, MS represents Unlock this Answer For Free Now! View this answer and more for free by performing one of the following actions Scan the QR code to install the App and get 2 free unlocks Unlock quizzes for free by uploading documents
![]()
![]()
![]()

