Figure 12-3. On the graph, MS represents the money supply and MD represents money demand. The usual quantities are measured along the axes.
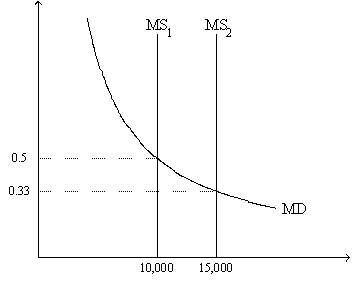
-Refer to Figure 12-3. At the end of 2009 the relevant money-supply curve was the one labeled MS1. At the end of 2010 the relevant money-supply curve was the one labeled MS2. Assuming the economy is always in equilibrium, what was the economy's approximate inflation rate for 2010?
A) -33 percent
B) 17 percent
C) 50 percent
D) 67 percent
Correct Answer:
Verified
Q82: Economic variables whose values are measured in
Q92: Figure 12-2. On the graph, MS represents
Q93: Figure 12-2. On the graph, MS represents
Q94: Figure 12-2. On the graph, MS represents
Q95: On a Sunday morning,Tom sold 300 cups
Unlock this Answer For Free Now!
View this answer and more for free by performing one of the following actions

Scan the QR code to install the App and get 2 free unlocks

Unlock quizzes for free by uploading documents