Figure 8-1. The figure depicts a demand-for-loanable-funds curve and two supply-of-loanable-funds curves.
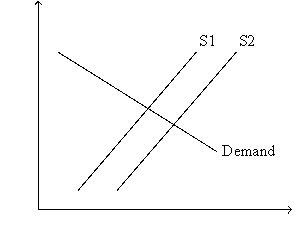
-Refer to Figure 8-1. Which of the following events would shift the supply curve from S1 to S2?
A) In response to tax reform, firms are encouraged to invest more than they previously invested.
B) In response to tax reform, households are encouraged to save more than they previously saved.
C) Government goes from running a balanced budget to running a budget deficit.
D) Any of the above events would shift the supply curve from S1 to S2.
Correct Answer:
Verified
Q93: Which of the following counts as part
Q94: If the government instituted an investment tax
Q97: In the market for loanable funds,the interaction
Q114: Which of the following are effects of
Q207: Suppose the government changed the tax laws,
Q363: Figure 8-2. The figure depicts a supply-of-loanable-funds
Q365: Figure 8-1. The figure depicts a demand-for-loanable-funds
Q366: Figure 8-3. The figure shows two demand-for-loanable-funds
Q368: Figure 8-3. The figure shows two demand-for-loanable-funds
Q372: Figure 8-2. The figure depicts a supply-of-loanable-funds
Unlock this Answer For Free Now!
View this answer and more for free by performing one of the following actions

Scan the QR code to install the App and get 2 free unlocks

Unlock quizzes for free by uploading documents