Figure 8-4. On the horizontal axis of the graph, L represents the quantity of loanable funds in billions of dollars.
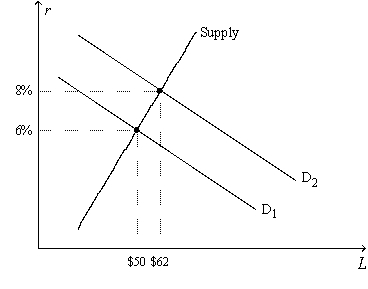
-Refer to Figure 8-4. Which of the following events could explain a shift of the demand-for-loanable-funds curve from to ? 

A) The tax code is reformed to encourage greater saving.
B) The tax code is reformed to encourage greater investment.
C) The government starts running a budget deficit.
D) The government starts running a budget surplus.
Correct Answer:
Verified
Q8: Lenders buy bonds and borrowers sell them.
Q125: In which case would people desire to
Q128: When the government goes from running a
Q135: If Congress instituted an investment tax credit
A)it
Q140: As real interest rates fall,firms desire to
A)buy
Q381: Other things the same, an increase in
Q394: Figure 8-4. On the horizontal axis of
Q395: Figure 8-4. On the horizontal axis of
Q397: Figure 8-4. On the horizontal axis of
Q400: Figure 8-4. On the horizontal axis of
Unlock this Answer For Free Now!
View this answer and more for free by performing one of the following actions

Scan the QR code to install the App and get 2 free unlocks

Unlock quizzes for free by uploading documents