Figure 8-4. On the horizontal axis of the graph, L represents the quantity of loanable funds in billions of dollars.
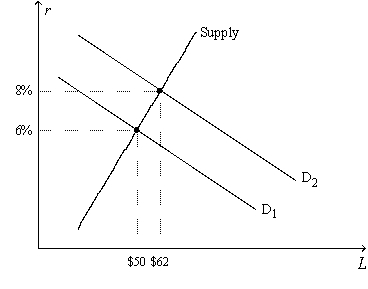
-Refer to Figure 8-4. If the equilibrium quantity of loanable funds is $50 billion and if the equilibrium nominal interest rate is 8 percent, then
A) there is an excess supply of loanable funds at a real interest rate of 6 percent.
B) there is an excess demand for loanable funds at a real interest rate of 8 percent.
C) the rate of inflation is approximately 2 percent.
D) the rate of inflation is approximately 14 percent.
Correct Answer:
Verified
Q1: Generally, if people begin to expect a
Q7: When a firm wants to borrow directly
Q8: Lenders buy bonds and borrowers sell them.
Q13: Banks and mutual funds are examples of
Q125: In which case would people desire to
Q140: As real interest rates fall,firms desire to
A)buy
Q395: Figure 8-4. On the horizontal axis of
Q396: Figure 8-4. On the horizontal axis of
Q397: Figure 8-4. On the horizontal axis of
Q404: If a share of stock in Skylight
Unlock this Answer For Free Now!
View this answer and more for free by performing one of the following actions

Scan the QR code to install the App and get 2 free unlocks

Unlock quizzes for free by uploading documents