A large automobile parts supplier, keeps track of the demand for a particular part needed by its customers, automobile manufacturers. The time series plot below shows monthly demand for this part (in thousands) for a five year period. 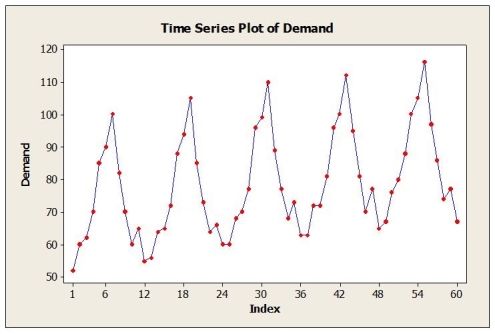 a. Identify the dominant time series component (s) in the data.
b. Suppose that the single exponential smoothing (SES) model was applied to these data. Below are time series graphs showing SES results using two different smoothing constants (α = 0.2 and α = 0.8). In which application is a larger value of α used?
I. 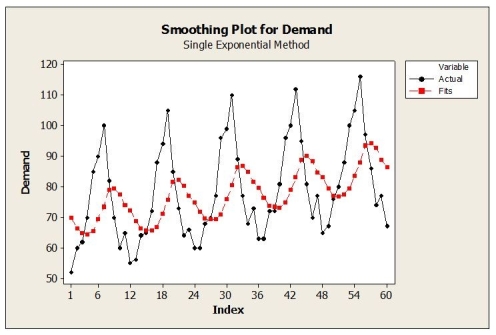 ii.
ii. 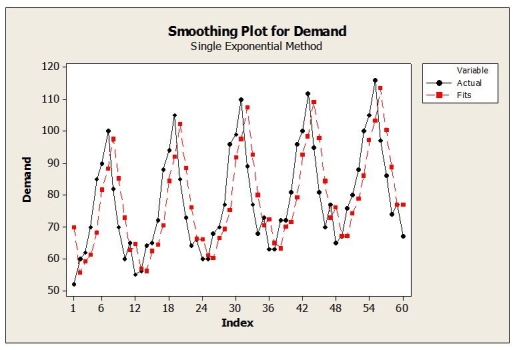 c. What forecasting method may be a better choice than SES for these data? Explain.
Correct Answer:
Verified
b. The SES mod...
View Answer
Unlock this answer now
Get Access to more Verified Answers free of charge
Q2: Annual estimates of the population in the
Q3: The table below shows the actual closing
Q5: Consider the following to answer the question(s)
Q6: Monthly closing stock prices, adjusted for dividends,
Q7: Consider the following to answer the question(s)
Q8: Quarterly sales data (in $10,000) for a
Q9: The following table shows actual sales values
Q10: Daily closing stock prices for Kyocera Corporation
Q11: Annual estimates of the population in a
Q20: Consider the following to answer the question(s)
Unlock this Answer For Free Now!
View this answer and more for free by performing one of the following actions

Scan the QR code to install the App and get 2 free unlocks

Unlock quizzes for free by uploading documents