Monthly closing stock prices, adjusted for dividends, were obtained for Boeing Corporation from January 2006 through August 2008 (closing price on the first trading day of the month). The time series graph of these data is shown below. 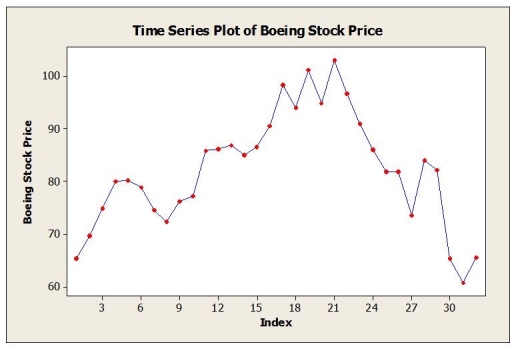 a. Below are the results of fitting a third-order autoregressive model, AR (3). Write out the model. Are the second and third lagged values significant? Explain.
 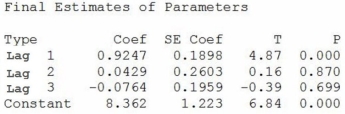 b. Below are the results of fitting a first-order autoregressive model, AR (1). Write out the model. Is this model typical for stock price data? Explain.
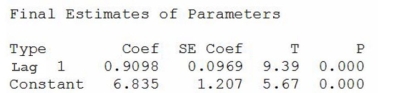
Correct Answer:
Verified
View Answer
Unlock this answer now
Get Access to more Verified Answers free of charge
Q2: Annual estimates of the population in the
Q3: The table below shows the actual closing
Q5: A large automobile parts supplier, keeps track
Q5: Consider the following to answer the question(s)
Q7: Consider the following to answer the question(s)
Q8: Quarterly sales data (in $10,000) for a
Q9: The following table shows actual sales values
Q10: Daily closing stock prices for Kyocera Corporation
Q11: Annual estimates of the population in a
Q20: Consider the following to answer the question(s)
Unlock this Answer For Free Now!
View this answer and more for free by performing one of the following actions

Scan the QR code to install the App and get 2 free unlocks

Unlock quizzes for free by uploading documents