The following scatterplot shows world population (millions) plotted against 5 year intervals from 1950 through 2000.
a. Based on the scatterplot, is the linear model appropriate? Explain. 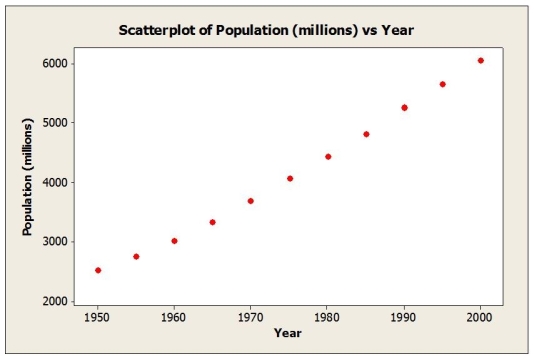 b. A linear regression model was estimated to describe the trend in world population over time. Based on the plot of residuals versus predicted values shown below, would you consider this model appropriate? Explain.
 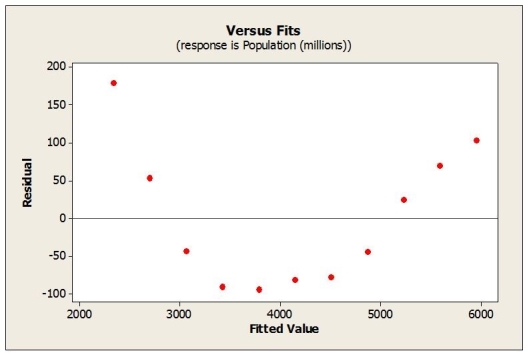 c. Would a re-expression of the data help? If so, what would you recommend?
Correct Answer:
Verified
View Answer
Unlock this answer now
Get Access to more Verified Answers free of charge
Q2: Which of the following re-expressions of the
Q2: Which of the following re-expressions of the
Q3: Quarterly sales figures for e-commerce retail sales
Q4: The advertising campaign for a high fibre
Q5: Data on Internet usage (per 100 inhabitants)
Q6: Consider the following to answer the question(s)
Q8: Quarterly figures for e-commerce retail sales were
Q10: Consider the following to answer the question(s)
Q11: Suppose that data on labour productivity and
Q12: The advertising campaign for a high fibre
Unlock this Answer For Free Now!
View this answer and more for free by performing one of the following actions

Scan the QR code to install the App and get 2 free unlocks

Unlock quizzes for free by uploading documents