Quarterly figures for e-commerce retail sales were obtained from the first quarter of 2001 through the fourth quarter of 2007. A regression model was estimated to describe the trend in e-commerce retail sales over time. What does the plot of residuals versus predicted values suggest? 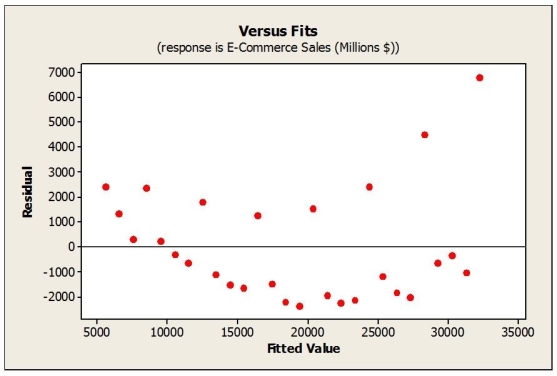
A) The data are not normal.
B) The linearity condition is not satisfied.
C) The equal spread condition is not satisfied.
D) The data are not normal, and the linearity condition is not satisfied.
E) The linearity condition is not satisfied, and the equal spread condition is not satisfied.
Correct Answer:
Verified
Q2: Which of the following re-expressions of the
Q3: Quarterly sales figures for e-commerce retail sales
Q4: The advertising campaign for a high fibre
Q5: Data on Internet usage (per 100 inhabitants)
Q6: Consider the following to answer the question(s)
Q7: The following scatterplot shows world population (millions)
Q10: Consider the following to answer the question(s)
Q11: Suppose that data on labour productivity and
Q12: The advertising campaign for a high fibre
Q13: Consider the following to answer the question(s)
Unlock this Answer For Free Now!
View this answer and more for free by performing one of the following actions

Scan the QR code to install the App and get 2 free unlocks

Unlock quizzes for free by uploading documents