A regression model was developed relating average annual pay to the percentage of women employed for a sample of companies. Below is the plot of residuals versus predicted values. 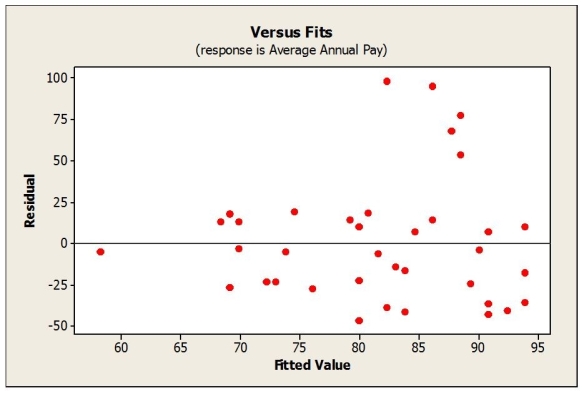 a. What can you see in the plot of residuals that may not have been clear in the original scatterplot of the data?
b. Would a re-expression of the data help? If so, what would you recommend?
Correct Answer:
Verified
View Answer
Unlock this answer now
Get Access to more Verified Answers free of charge
Q2: Which of the following re-expressions of the
Q10: Consider the following to answer the question(s)
Q11: Suppose that data on labour productivity and
Q12: The advertising campaign for a high fibre
Q13: Consider the following to answer the question(s)
Q15: Data were collected for a sample of
Q16: Monthly closing stock prices for a utility
Q17: Quarterly figures for e-commerce retail sales were
Q18: What does the plot of the residuals
Q19: Data were collected for a sample of
Unlock this Answer For Free Now!
View this answer and more for free by performing one of the following actions

Scan the QR code to install the App and get 2 free unlocks

Unlock quizzes for free by uploading documents