Monthly closing stock prices for a utility company were obtained from January 2007 through August 2008. A regression model was estimated to describe the trend in closing stock prices over time.
a. Based on the plot of residuals versus predicted values, is the linear model appropriate? Explain. 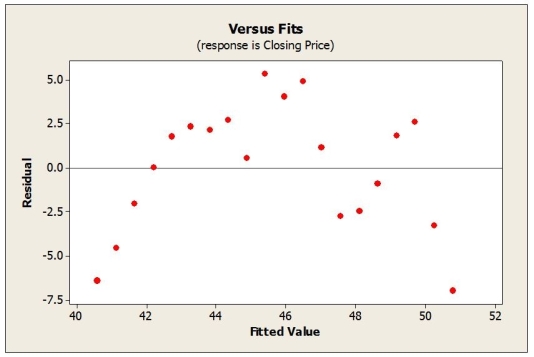 b. The Durbin-Watson statistic for this regression was found to be 0.5626. What can you conclude from this statistic at the 0.01 level of significance?
Correct Answer:
Verified
View Answer
Unlock this answer now
Get Access to more Verified Answers free of charge
Q11: Suppose that data on labour productivity and
Q12: The advertising campaign for a high fibre
Q13: Consider the following to answer the question(s)
Q14: A regression model was developed relating average
Q15: Data were collected for a sample of
Q17: Quarterly figures for e-commerce retail sales were
Q18: What does the plot of the residuals
Q19: Data were collected for a sample of
Q20: Consider the following to answer the question(s)
Q28: Consider the following to answer the question(s)
Unlock this Answer For Free Now!
View this answer and more for free by performing one of the following actions

Scan the QR code to install the App and get 2 free unlocks

Unlock quizzes for free by uploading documents