Consider the following to answer the question(s) below:
Monthly closing stock prices for a utility company were obtained from January 2007 through August 2008. A regression model was estimated to describe the trend in closing stock prices over time. 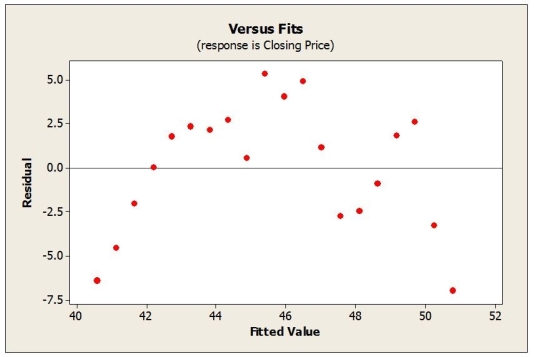
-What does the plot of residuals below suggest?
A) An outlier is present in the data set.
B) The linearity condition is not satisfied.
C) A high leverage point is present in the data set.
D) The data are not normal.
E) The equal spread condition is not satisfied.
Correct Answer:
Verified
Q15: Data were collected for a sample of
Q16: Monthly closing stock prices for a utility
Q17: Quarterly figures for e-commerce retail sales were
Q18: What does the plot of the residuals
Q19: Data were collected for a sample of
Q22: Consider the following to answer the question(s)
Q23: The best practice for modelling this data
Q25: A new movie is in the making
Q27: Consider the following to answer the question(s)
Q28: Consider the following to answer the question(s)
Unlock this Answer For Free Now!
View this answer and more for free by performing one of the following actions

Scan the QR code to install the App and get 2 free unlocks

Unlock quizzes for free by uploading documents