The table below shows data on total assets ($ million) for a sample of a bank's branches.
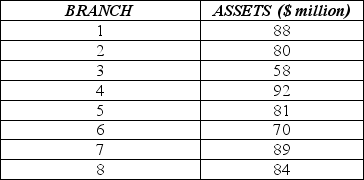 For the data on total assets ($ million) for the sample provided:
a. Calculate the mean.
b. Calculate the standard deviation.
c. Standardize the asset value of the third branch (find the z score). Interpret its meaning.
Correct Answer:
Verified
b. $11.27 ...
View Answer
Unlock this answer now
Get Access to more Verified Answers free of charge
Q3: Consider the following to answer the question(s)
Q4: Consider the following to answer the question(s)
Q4: Consider the following to answer the question(s)
Q6: The boxplots show monthly sales revenue figures
Q7: Below is a histogram of salaries (in
Q8: Consider the following to answer the question(s)
Q9: The table below shows closing share prices
Q10: Below is the five-number summary of salaries
Q11: Below is a time series graph for
Q13: Consider the following to answer the question(s)
Unlock this Answer For Free Now!
View this answer and more for free by performing one of the following actions

Scan the QR code to install the App and get 2 free unlocks

Unlock quizzes for free by uploading documents