Below is a time series graph for monthly closing price of 3M Dental Products stock (beginning June 2005). 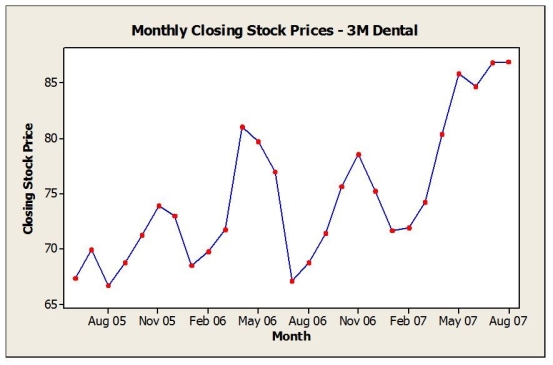 a. Are the closing prices for shares of 3M Dental Products from June 2005 through August 2007 stationary? Explain.
b. Would a histogram provide a good summary of these stock prices? Explain.
Correct Answer:
Verified
View Answer
Unlock this answer now
Get Access to more Verified Answers free of charge
Q4: Consider the following to answer the question(s)
Q6: The boxplots show monthly sales revenue figures
Q7: Below is a histogram of salaries (in
Q8: The table below shows data on total
Q9: The table below shows closing share prices
Q10: Below is the five-number summary of salaries
Q13: Consider the following to answer the question(s)
Q14: Data were collected on the hourly wage
Q16: The boxplots below show the closing share
Q18: Consider the following to answer the question(s)
Unlock this Answer For Free Now!
View this answer and more for free by performing one of the following actions

Scan the QR code to install the App and get 2 free unlocks

Unlock quizzes for free by uploading documents