Annual estimates of the population in the age group 65+ in a mid-sized city from 2005 (t = 1) onward are shown in the time series graph below. 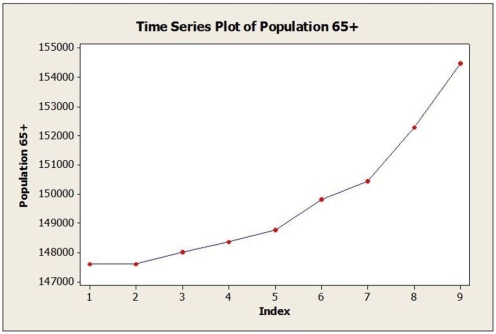 a. Identify the dominant time series component(s) in the data.
b. Below are the results from fitting a linear trend model to the data. Use this model to estimate the 65+ population in this city for 2014 (t = 10).
Fitted Trend Equation  , = 145,703 + 801t
c. Below are the results from fitting a quadratic trend model to the data. Use this model to estimate the 65+ population in this city for 2014 (t = 10).
Fitted Trend Equation  , = 148,187 - 554t + 135.5t2
d. The actual population estimate for 2014 is 157,218. Which model does better? Why?
Correct Answer:
Verified
b. 153,713
...
View Answer
Unlock this answer now
Get Access to more Verified Answers free of charge
Q5: Consider the following to answer the question(s)
Q6: Consider the following to answer the question(s)
Q7: Daily closing stock prices for Kyopera Corporation
Q8: Consider the following to answer the question(s)
Q9: Consider the following to answer the question(s)
Q11: Annual estimates of the population in the
Q12: Consider the following to answer the question(s)
Q13: Consider the following to answer the question(s)
Q14: Quarterly sales data (in $10,000) for a
Q15: The MSE for the forecasting method used
Unlock this Answer For Free Now!
View this answer and more for free by performing one of the following actions

Scan the QR code to install the App and get 2 free unlocks

Unlock quizzes for free by uploading documents