Consider the following to answer the question(s) below:
Annual estimates of the population in a certain city from 2005 (t = 1) onward are shown in the time series graph below. 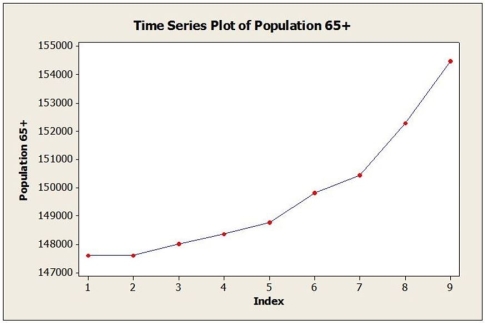
-The dominant component in this time series is
A) cyclical.
B) irregular.
C) seasonal.
D) trend.
E) No time series component is dominant. The time series is random walk.
Correct Answer:
Verified
Q7: Daily closing stock prices for Kyopera Corporation
Q8: Consider the following to answer the question(s)
Q9: Consider the following to answer the question(s)
Q10: Annual estimates of the population in the
Q11: Annual estimates of the population in the
Q13: Consider the following to answer the question(s)
Q14: Quarterly sales data (in $10,000) for a
Q15: The MSE for the forecasting method used
Q16: The following table shows actual sales values
Q17: Annual estimates of the population in a
Unlock this Answer For Free Now!
View this answer and more for free by performing one of the following actions

Scan the QR code to install the App and get 2 free unlocks

Unlock quizzes for free by uploading documents