Consider the following to answer the question(s) below:
Quarterly sales data (in $10,000) for a small company specializing in green cleaning products are shown in the time series graph below. 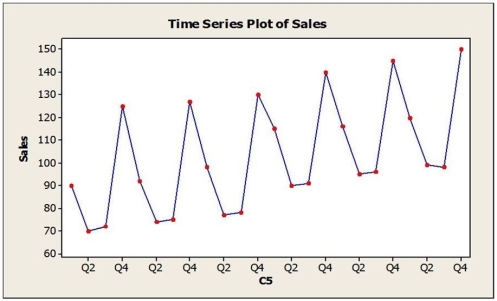 A seasonal regression model was fit to these data and the results are shown below.
The regression equation is Sales = 89.06 + 1.37t - 23.37Q2 - 23.91Q3 + 27.88Q4. 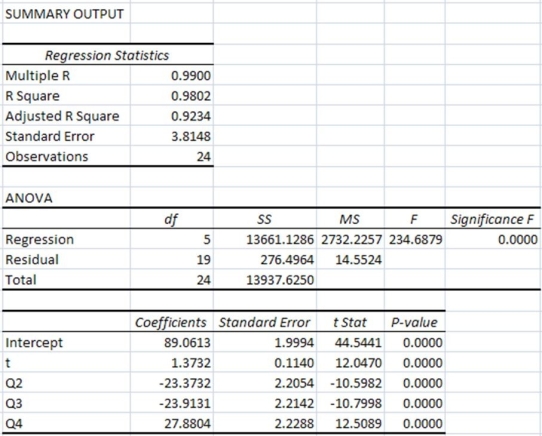
-Which of the following is not true?
A) The seasonal regression model is significant in explaining sales as indicated by the F-statistic and associated P-value.
B) The seasonal regression model explains 98.02% of the variation in sales.
C) The t-statistics and associated P-values indicate that all dummy variables representing quarters are significant.
D) Q1 is the quarter without dummy variable. The next year sales in Q1 is predicted to be $1,233,100.
E) The seasonal regression model is not significant overall as only Q1 is significant.
Correct Answer:
Verified
Q14: Quarterly sales data (in $10,000) for a
Q15: The MSE for the forecasting method used
Q16: The following table shows actual sales values
Q17: Annual estimates of the population in a
Q18: A large automobile parts supplier keeps track
Q20: Consider the following to answer the question(s)
Q21: A company has recorded annual sales (in
Q22: Consider the following to answer the question(s)
Q23: Which of the following statement is true
Q24: Consider the following to answer the question(s)
Unlock this Answer For Free Now!
View this answer and more for free by performing one of the following actions

Scan the QR code to install the App and get 2 free unlocks

Unlock quizzes for free by uploading documents