Monthly closing stock prices for a utility company were obtained from January 2014 through August 2015. A regression model was estimated to describe the trend in closing stock prices over time.
a. Based on the plot of residuals versus predicted values, is the linear model appropriate? Explain. 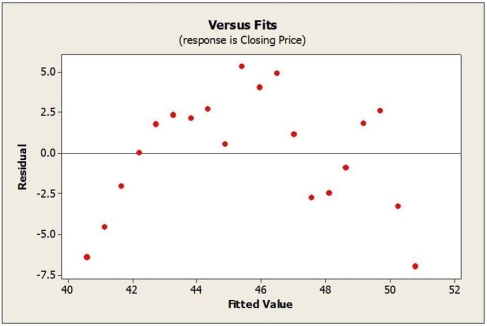 b. The Durbin-Watson statistic for the collected data was found to be 0.5626. What can you conclude from this statistic at the 0.01 level of significance?
Correct Answer:
Verified
Q1: Data on Internet usage (per 100 inhabitants)
Q2: Data were collected for a sample of
Q4: The following scatterplot shows the population of
Q5: Quarterly sales figures for e-commerce retail sales
Q6: A food company launches an advertising campaign
Q7: Consider the following to answer the question(s)
Q8: Consider the following to answer the question(s)
Q9: Consider the following to answer the question(s)
Q10: Consider the following to answer the question(s)
Q11: Consider the following to answer the question(s)
Unlock this Answer For Free Now!
View this answer and more for free by performing one of the following actions

Scan the QR code to install the App and get 2 free unlocks

Unlock quizzes for free by uploading documents