Consider the following to answer the question(s) below:
Monthly closing stock prices for a utility company were obtained from January 2014 through August 2015. A regression model was estimated to describe the trend in closing stock prices over time. 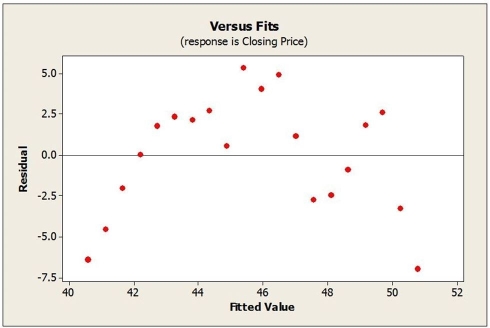
-What does the plot of residuals above suggest?
A) An outlier is present in the data set.
B) The Linearity condition is not satisfied.
C) A high-leverage point is present in the data set.
D) Extrapolation was used.
E) There is no pattern. The relationship seems reasonably straight.
Correct Answer:
Verified
Q2: Data were collected for a sample of
Q3: Monthly closing stock prices for a utility
Q4: The following scatterplot shows the population of
Q5: Quarterly sales figures for e-commerce retail sales
Q6: A food company launches an advertising campaign
Q8: Consider the following to answer the question(s)
Q9: Consider the following to answer the question(s)
Q10: Consider the following to answer the question(s)
Q11: Consider the following to answer the question(s)
Q12: Quarterly figures for e-commerce retail sales were
Unlock this Answer For Free Now!
View this answer and more for free by performing one of the following actions

Scan the QR code to install the App and get 2 free unlocks

Unlock quizzes for free by uploading documents