In a population with low death rates, this age structure diagram indicates that 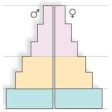
A) the population is decreasing.
B) the population is stable.
C) the biotic potential must be larger than usual.
D) the population will continue to grow for some time.
Correct Answer:
Verified
Q16: In the logistic growth curve formula,when N
Q22: A(n)_ consists of all the populations of
Q24: Only the LDCs will be experiencing overpopulation
Q25: Which of these diagrams represents an age
Q26: Which of the following circumstances would cause
Q27: The sequence of decreased death rate followed
Q29: Which variable is not a density-dependent factor?
A)
Q32: As the carrying capacity of an environment
Q36: Density-independent factors which play a role in
Q40: In the near future,the human population is
Unlock this Answer For Free Now!
View this answer and more for free by performing one of the following actions

Scan the QR code to install the App and get 2 free unlocks

Unlock quizzes for free by uploading documents